By Mike Krueger*
Another USDA-WASDE (world supply and demand) report has come and gone with little impact on the markets. There were no adjustments to any production estimates. Those adjustments, if there are any, will happen in the January “final” acreage and yield estimates.
That should include estimates of sunflower production.
U.S. soybean supply and demand estimates were left unchanged in the December WASDE. Ending stocks are estimated to be 290 million bushels. That is tight.
Domestic soybean crush continues to establish new records every month. That trend is expected to continue. The expansion in the soybean crush has offset some of the loss in export sales to China.
There is also more confusion over the deal reached with China last October in which they agreed to buy 12 MMTs (440 million bushels) by the end of this crop year. The confusion is over just when is the end of the soybean crop year? Some say it is the end of December.; some say it is the end of February. The actual soybean marketing year runs from September 1 through August 31.
China has been buying U.S. soybeans since the agreement was announced in late October. No one knows exactly how much because the USDA is still playing catch-up with the weekly export sales reports, which didn’t happen during the government shutdown. Most estimates are that China has bought between three and four million MMTs (around 150 million bushels). That is a very long ways from 440 million bushels.
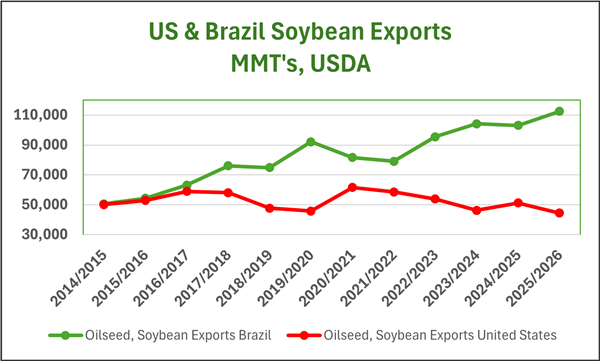
The accompanying chart below traces U.S. soybean production and export levels across the past decade.
USDA did increase the corn export forecast by 125 million bushels in the December WASDE. As a result, the ending stocks estimate was reduced by an equal amount and now stands just above the two-billion-bushel level. That’s still a big number, but it is likely that the corn yield and production estimates will be reduced in the January “final” report and that the corn export forecast will be increased again. That would mean another reduction in corn ending stocks.
The world corn numbers are also gradually getting smaller. This will put more pressure on the size of the coming corn crop in Brazil. Corn is starting to show some bullish signs of life as we enter 2026.
The USDA left the U.S. wheat numbers exactly unchanged from the November report. The world wheat production numbers, however, got bigger. The USDA increased Canada and Argentina’s wheat production estimates to new record-high levels. They also increased their wheat production estimate for Australia and the EU.
The 2025 world wheat crop set a new all-time record. The positive news for wheat is that world wheat consumption also set a new record. World wheat ending supplies and the stocks-to-use ratio have declined for six consecutive years despite record world production. The wheat markets will now be sensitive to any potential wheat production problems if they arise.
USDA also recently released their preliminary 10-year baseline supply and demand projections for soybeans, corn and wheat. Of course, trying to guess what might happen to planted acres, yields and demand out 10 years is a difficult task. These numbers are primarily used as a resource to help the USDA’s budgeting process for costs related to various parts of the farm program, but the market at least takes a look to try to identify acreage and ending stocks trends.
Two important trends in these recent numbers are:
• Total planted acreage for soybeans, corn and wheat don’t change very much over the 10-year period. We simply don’t have any large tracts of “new” acres to plant. We don’t have the Amazon rain forest available to clear and plant.
• The second trend is that the USDA is using record yield estimates in every year of the 10-year period while ending supply estimates stay the same. Throw a yield problem into the mix and things get interesting quickly.
A follow-on story is that the U.S. will continue to lose world market share in production and export markets. It’s a simple math calculation. We produce the same while world production increases. Our percentage of world trade has to gradually decline under those circumstances. The U.S. exports about 45% of its wheat production, 20% of its corn production and just under 40% of its soybean production.
The oil sunflower market continues to remain firm, still well above year-ago levels, while we wait for the USDA to give us sunflower production estimates in their January annual summary report.
* Mike Krueger founded The Money Farm, and is now a senior analyst with World Perspectives, a Washington, D.C.-based consulting company. While the information in this article is believed to be reliable, marketing involves risk, and the author and The Sunflower assume no responsibility for its use.